Miêu tả biểu đồ bằng tiếng Anh là dạng đề phổ biến trong bài thi Writing task 1 IELTS Academic. Đồng thời đây còn là tình huống thường gặp trong công việc. Mỗi loại biểu đồ có cách mô tả khác nhau. Để có thể giải thích đúng biểu đồ, bạn cần phải hiểu đúng ý nghĩa của từng dạng.
Tham khảo bài viết dưới đây của ieltscaptoc.com.vn để biết cách miêu tả biểu đồ bằng tiếng Anh đơn giản mà hiệu quả nhất.
Nội dung chính
1. Các loại biểu đồ trong tiếng Anh và ý nghĩa
1.1. Biểu đồ đường (Line Graph)
Diễn đạt sự tăng trưởng, thay đổi và chuyển dịch theo thời gian của một yếu tố. Ngoài ra biểu đồ đường còn diễn đạt sự phụ thuộc của 1 yếu tố vào 2 yếu tố còn lại.
1.2. Biểu đồ cột (Bar Chart)
Giúp so sánh giá trị các đối tượng theo cùng 1 tiêu chí. Đồng thời biểu đồ cột ghép còn thể hiện sự tăng giảm qua các năm của các đối tượng.
1.3. Biểu đồ tròn (Pie Chart)
Là dạng biểu đồ dùng để trình bày thông tin/ thông số của một vùng/ quốc gia/ nơi chốn ở các thời điểm khác nhau. Biểu đồ này còn dùng để biểu diễn, so sánh sự khác biệt của các chủ thể (quốc gia, thành phố, giới tính, etc.) tại cùng một thời gian, hoặc cũng có thể khác thời gian.
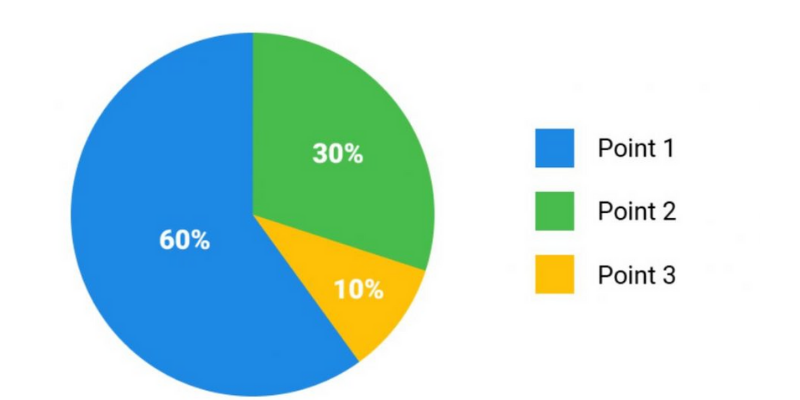
Khi so sánh các biểu đồ tròn sẽ thấy được sự tăng giảm của từng đối tượng nhưng không thấy được sự thay đổi của tổng thể.
1.4. Bảng (Table)
Bảng cung cấp số liệu cụ thể của từng đối tượng qua nhiều thời điểm. Nhìn vào bảng sẽ so sánh được các đối tượng cũng như sự thay đổi trong từng thời điểm cụ thể.
1.5. Các dạng biểu đồ khác
- Bar chart: biểu đồ ngang
- Area chart: biểu đồ miền
- Donut chart: biểu đồ tròn khuyết
- Bubble chart: biểu đồ bong bóng
- Spider chart: biểu đồ mạng nhện
- Radar chart: biểu đồ ra đa
- Scatter chart: biểu đồ phân tán
- Comparison chart: biểu đồ đối chiếu
- Stacked bar chart: biểu đồ ngang phân đoạn
- Gauges chart: biểu đồ tốc độ
Xem thêm: Tải sách Cambridge Vocabulary for IELTS
2. Bố cục bài miêu tả biểu đồ bằng tiếng Anh
2.1. Introduction
Trong bài miêu tả biểu đồ bằng tiếng Anh, phần Intro sẽ viết lại câu đề bài bằng văn phong của bạn, thường gọi là paraphrase câu đề bài. Tuy nhiên không sử dụng lại các từ vựng trong đề mà phải dùng các từ đồng nghĩa và cấu trúc câu khác. Như vậy bạn mới đạt điểm phần này.
Sử dụng 1 – 2 câu miêu tả biểu đồ bằng tiếng Anh đề người đọc biết biểu đồ này nói về vấn đề gì, địa điểm, thời gian, cái gì được miêu tả,…
2.2. Overview
Overview là phần chỉ ra xu hướng của biểu đồ, cụ thể là tăng hay giảm. Những sự thay đổi rõ ràng, mang tính tổng quát nhất và thông tin nổi bật mà biểu đồ thể hiện cần được viết ra, tránh lan man dài dòng hoặc đánh giá quá chung về biểu đồ.
Hãy chú ý đến số liệu cao nhất và thấp nhất vì có thể đây là cột mốc để đánh giá các số liệu khác. Tốc độ thay đổi của số liệu là mức tăng giảm như thế nào, mạnh nhẹ ra sao đều phải nêu ra trong bài viết. Nên dùng cấu trúc so sánh để nói về 2 hay nhiều số liệu khác nhau.
Bên cạnh đó không đưa số liệu cụ thể vào phần Overview vì chúng ta sẽ nhắc đến trong phần Body.
2.3. Body
Gồm 2 đoạn, mỗi đoạn sẽ viết về một khoảng thời gian hay một xu hướng nào đó, là ý chính của biểu đồ.
Trong mỗi đoạn chỉ viết ý chính nổi bật. Vì biểu đồ thường chứa rất nhiều thông tin nên bạn cần chọn lọc ý quan trọng nhất để viết. Tránh nêu ra hết mọi thông tin, số liệu vì sẽ không đủ thời gian làm bài.
Cần nêu được điểm tương đồng khi nhận xét biểu đồ bằng tiếng Anh như xu hướng thay đổi (tăng/giảm/không đổi). Sau đó nhóm lại thành 2 nhóm thông tin để mô tả trong 2 đoạn văn. Mỗi đoạn văn từ 3 – 4 câu miêu tả 1 nhóm thông tin.
3. Lưu ý khi nhận xét biểu đồ bằng tiếng Anh
3.1. Giới thiệu rõ ràng
Phần Introduction giúp người đọc biết được nội dung chính của biểu đồ, những điều mà bạn muốn truyền đạt.
Vì vậy bạn cần giới thiệu đầy đủ tên biểu đồ, cách theo dõi biểu đồ như các đối tượng, trục tung trục hoành, mảng, đơn vị hay các chú thích của biểu đồ. Phần này càng rõ càng tốt.
3.2. Đi từ tổng quan đến chi tiết
Bạn cần đi từ tổng quan đến chi tiết khi miêu tả biểu đồ bằng tiếng Anh. Từ nhận xét khái quát đó, bạn sẽ đi sâu vào chi tiết, bổ sung ý nghĩa cho nội dung chính được nhắc đến trước đó. Những số liệu trên biểu đồ sẽ làm rõ ràng, nổi bật lên những thông tin trước đó.
3.3. Chọn các số liệu quan trọng
Biểu đồ chứa rất nhiều thông tin nên việc nêu lên hết mọi thứ sẽ không hiệu quả trong 1 bài văn ngắn. Người đọc cũng sẽ choáng với lượng thông tin bạn cung cấp.

Do đó, bài miêu tả biểu đồ bằng tiếng Anh hiệu quả là bài chọn lọc dữ liệu tiêu biểu, những số liệu mang tính quyết định, liên quan trực tiếp đến bài hoặc tên biểu đồ.
Chọn thông tin cho phần Overview
Phần này hãy khái quát thông tin, không nêu số liệu cụ thể.
Chọn thông tin cho phần Body
Phân tích xu hướng, sự thay đổi của số liệu qua từng thời điểm cụ thể. Nhóm các yếu tố có cùng đặc điểm để so sánh với nhau. Làm rõ được ý chính mà biểu đồ thể hiện.
Đối với dạng bảng (Table)
Đối với dạng bảng sẽ chứa nhiều thông tin, số liệu, đối tượng,… Vì vậy để không lan man, bạn hãy tìm ra con số nổi bật nhất bảng (ví dụ lớn nhất/nhỏ nhất cột/hàng).
Nếu trong bảng đề cập đến thời gian hãy tìm con số lớn nhất qua các năm. Đồng thời không mô tả từng tiêu chí mà hãy chọn số liệu lớn nhất và nhỏ nhất trong bảng để so sánh với nhau.
3.4. Từ vựng và ngữ pháp
Từ vựng và ngữ pháp là yếu tố quan trọng không thể thiếu trong mọi bài viết, kể cả biểu đồ. Hãy chú ý cách đọc số nguyên, phần trăm, phân số, tỷ lệ,… Bên cạnh đó thì dùng trong biểu đồ cũng phải chú ý.
Đối với số liệu ở hiện tại thì dùng hiện tại đơn, số liệu từ quá khứ thì dùng quá khứ đơn và các xu hướng thay đổi, diễn biến từ quá khứ đến hiện tại thì dùng hiện tại hoàn thành. Còn với những dự báo tương lai thì dùng dùng tương lai đơn. Ngoài ra vận dụng thêm tính từ, trạng từ để thể hiện mức độ sẽ làm bài viết hay và thuyết phục hơn.
4. Cách miêu tả biểu đồ bằng tiếng Anh với dạng bài có 2 biểu đồ
4.1. Cách miêu tả biểu đồ
Dạng bài có 2 biểu đồ là Mixed chart. Cách miêu tả biểu đồ bằng tiếng Anh cho dạng mixed chart cũng không khác những loại biểu đồ khác. Tuy nhiên đoạn 1 phần body sẽ mô tả biểu đồ 1, đoạn 2 mô tả biểu đồ 2. Mỗi đoạn chắt lọc thông tin quan trọng nhất mà biểu đồ thể hiện nếu không sẽ không đủ thời gian làm bài. Ở dạng 2 biểu đồ, bạn không cần tốn công chia số liệu cho phần body.
4.2. Các lỗi cần tránh khi làm bài thi IELTS
- Viết quá nhiều thông tin: 2 biểu đồ có cung cấp rất nhiều thông tin. Vì vậy hãy chọn ra những thông tin cần thiết nhất và đi sâu vào đó. Đừng chú trọng những thông tin bên lề vì dễ làm loãng bài.
- Không tìm thấy điểm nổi bật của 2 biểu đồ: đây là điểm khó khi bạn không nhận thấy điểm nổi bật của 2 biểu đồ để so sánh. Hãy chú ý đến số liệu lớn nhất, nhỏ nhất, xu hướng thay đổi để so sánh 2 biểu đồ với nhau.
- So sánh không đúng đối tượng và mục đích: nếu không tìm thấy đối tượng so sánh, bạn có thể bỏ qua. Tuyệt đối không so sánh sai đối tượng với nhau vì chúng hoàn toàn vô nghĩa. Bạn có thể so sánh số liệu trong cùng một biểu đồ nếu cần thiết.
5. Các mẫu câu thường dùng để miêu tả biểu đồ trong tiếng Anh
Để miêu tả biểu đồ bằng tiếng Anh, bạn có thể tham khảo các mẫu phổ thông bên dưới nhé!
Phần giới thiệu
- The pie chart/bar chart/line graph is about…
- The pie chart/bar chart/line graph deals with…
- The below chart/graph shows…
- The chart/graph is divided into…parts
- The slices part of the pie chart compare…
- The chart/graph highlights…
- The chart/graph represents…
Cách diễn đạt, so sánh các số liệu
- …has the largest/second largest
- The largest/second largest number of … are/is in…
- …is bigger than…
- …is as big as …
- There are more than twice/three times as … as …
- There are only…
- …take/takes …percent
- Only one third/…% (percent)
- Less than half …
- …stand at…
- …fluctuate around …
Mô tả xu hướng tăng
- …have an increase/a rise/a growth/an upward trend in…
- …rise/increase/grow/expand/improve to…/from … to…
- …go up to…
- …climb to…
- The number …increases/goes up/grows by…
- …peak/reach a peak…
Mô tả xu hướng giảm
- …has/have decrease/a fall/a decline/a drop/a reduction in…
- …fall/decline/decrease /dip/drop/go down/reduce to/from …to …
- The number…decreases/goes down/sinks by…
- …reach a trough…
Mô tả xu hướng ổn định
- … have a levelling out/no change in …
- … maintain/keep/stay/remain stable at …
- … not change/level out…
Trạng từ miêu tả tốc độ thay đổi
- Nhanh: rapidly, quickly, swiftly
- Thình lình, đột ngột: suddenly, sharply, dramatically
- Dần dần: gradually
- Đều: steadily, constantly
- Chậm: slowly
Trạng từ miêu tả cường độ thay đổi
- Lớn, khổng lồ: massively, hugely, tremendously, enormously, steeply
- Nhiều, đáng kể, ở mức cơ bản thường thấy: markedly, significantly, considerably
- Vừa phải: moderately, substantially
- Nhẹ: slightly, gently
6. Bài mẫu miêu tả biểu đồ bằng tiếng Anh
6.1. Bài mẫu miêu tả biểu đồ bằng tiếng Anh 1
The chart shows the average daily minimum and maximum levels of air pollutants in 4 cities 2000.
The given bar chart presents the daily minimum and maximum levels of SO2 and N2O which caused pollution in 4 different cities (Los Angeles, Calcutta, Beijing and Mexico City) in the year 2000. Overall, Mexico City was by far the most contaminated by the two mentioned pollutants among the four cities.
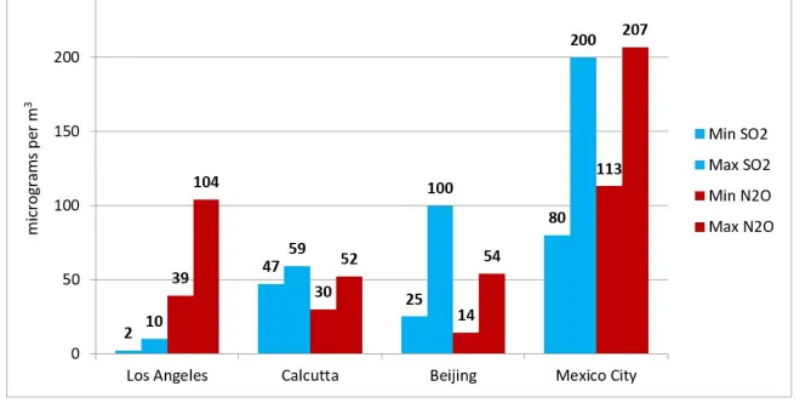
In Los Angeles, the quantity of SO2 emitted into the atmosphere was the lowest of all cities, with a minimum average of 2 micro-grams per m3 and a maximum average five times as much, at 10 micro-grams. The levels of N2O emissions were much higher with the maximum daily average level reaching up to more than 100 micro-grams per m3. Meanwhile, the atmosphere in Mexico City was severely polluted by SO2 and N2O emissions with the daily minimum and maximum averages of 80 and 113 micro-grams per m3 respectively.
In contrast to Los Angeles and Mexico City, the amount of pollution caused by N2O in Calcutta and Beijing was less than that caused by SO2. The daily average maximum figures for SO2 emissions were 59 micro-grams per m3 in Calcutta and 130 micro-grams per m3 in Beijing while the average maximum figures for N2O were just over 50 micro-grams per m3 in both cities.
Xem thêm: Tải Ebook Model Essays For IELTS Writing
6.2. Bài mẫu miêu tả biểu đồ bằng tiếng Anh 2
The chart shows the proportion of renewable energy in total energy supply in 4 countries from 1997 to 2010.
The given bar chart presents data about the percentages of renewable energy with regards to the total energy production in four different countries (Australia, Sweden, Iceland and Turkey) in three years; 1997, 2000 and 2010.
Overall, Sweden and Iceland witnessed an upward trend in the use of renewable energy sources in the three examined years. It can also be seen that among the four countries, this type of energy was most popular in Iceland.
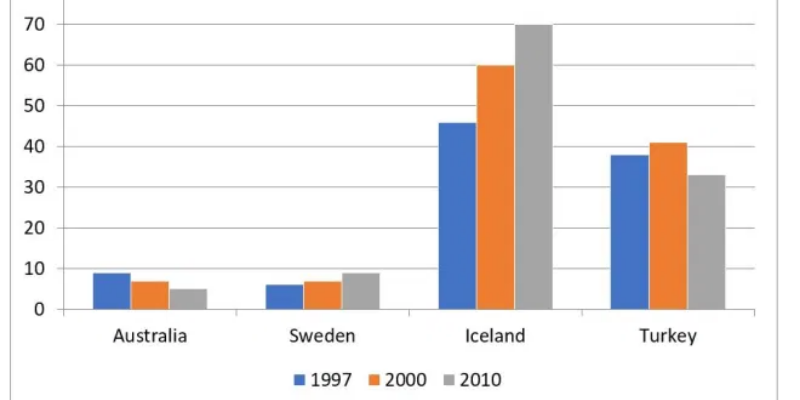
In 1997, almost half of the total energy produced in Iceland came from renewable resources. This figure continued to climb steadily to 60% in 2000 and more than 70% in 2010. Meanwhile, in 1997, only approximately 5% of the entire amount of energy produced was generated from natural resources in Sweden, who experienced a similar trend to that of Iceland in regards to the proportion of renewable energy produced.
Regarding Australia, nearly 10% of the energy supply was from renewable resources in 1997, and this figure decreased slightly to around 5% in 2010. Similarly, the percentage of renewable energy used in Turkey experienced a decline over the years from approximately 37% in 1997 down to just under 35% in 2010.
6.3. Bài mẫu miêu tả biểu đồ bằng tiếng Anh 3
The graph below shows the proportion of the population aged 65 and over between 1940 and 2040 in three different countries
The line graph compares the percentage of people aged 65 or more in three countries over a period of 100 years.
It is clear that the proportion of elderly people increases in each country between 1940 and 2040. Japan is expected to see the most dramatic changes in its elderly population.
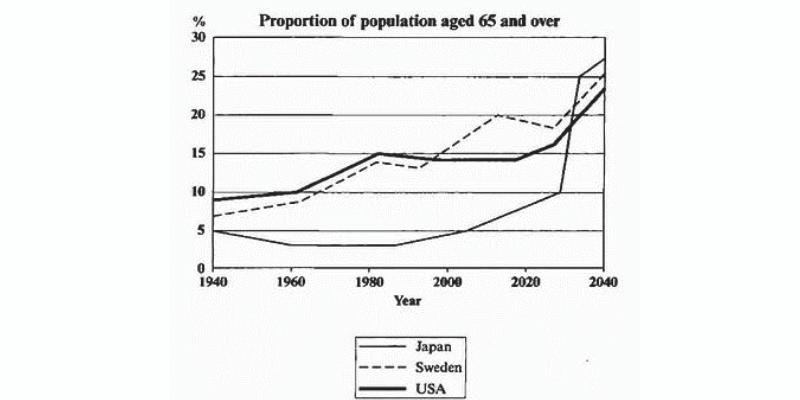
In 1940, around 9% of Americans were aged 65 or over, compared to about 7% of Swedish people and 5% of Japanese people. The proportions of elderly people in the USA and Sweden rose gradually over the next 50 years, reaching just under 15% in 1990. By contrast, the figures for Japan remained below 5% until the early 2000s.
Looking into the future, a sudden increase in the percentage of elderly people is predicted for Japan, with a jump of over 15% in just 10 years from 2030 to 2040. By 2040, it is thought that around 27% of the Japanese population will be 65 years old or more, while the figures for Sweden and the USA will be slightly lower, at about 25% and 23% respectively.
6.4. Bài mẫu miêu tả biểu đồ bằng tiếng Anh 4
The percentage of people using various mobile phone features
Sample Answer
The table compares the percentages of people using different functions of their mobile phones between 2006 and 2010.
Throughout the period shown, the main reason why people used their mobile phones was to make calls. However, there was a marked increase in the popularity of other mobile phone features, particularly the Internet search feature.
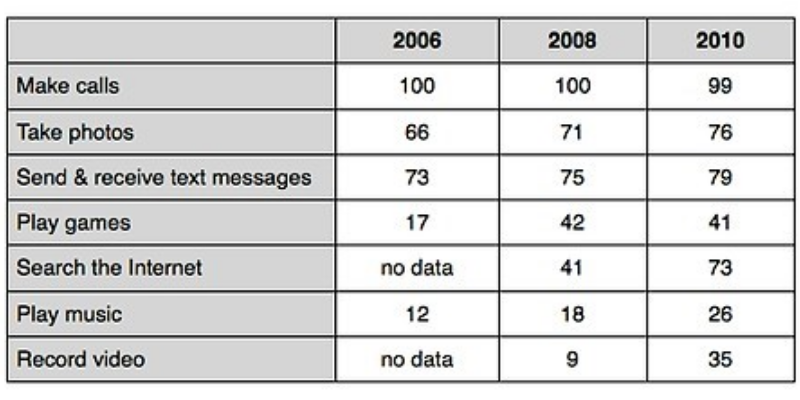
In 2006, 100% of mobile phone owners used their phones to make calls, while the next most popular functions were text messaging (73%) and taking photos (66%). By contrast, less than 20% of owners played games or music on their phones, and there were no figures for users doing Internet searches or recording video.
Over the following 4 years, there was relatively little change in the figures for the top three mobile phone features. However, the percentage of people using their phones to access the Internet jumped to 41% in 2008 and then to 73% in 2010. There was also a significant rise in the use of mobiles to play games and to record video, with figures reaching 41% and 35% respectively in 2010.
6.5. Bài mẫu miêu tả biểu đồ bằng tiếng Anh 5
The two maps below show an island, before and after the construction of some tourist facilities. Summarise the information by selecting and reporting the main features, and make comparisons where relevant.
Sample Answer
The diagrams illustrate some changes to a small island which has been developed for tourism.
It is clear that the island has changed considerably with the introduction of tourism, and six new features can be seen in the second diagram. The main developments are that the island is accessible and visitors have somewhere to stay.
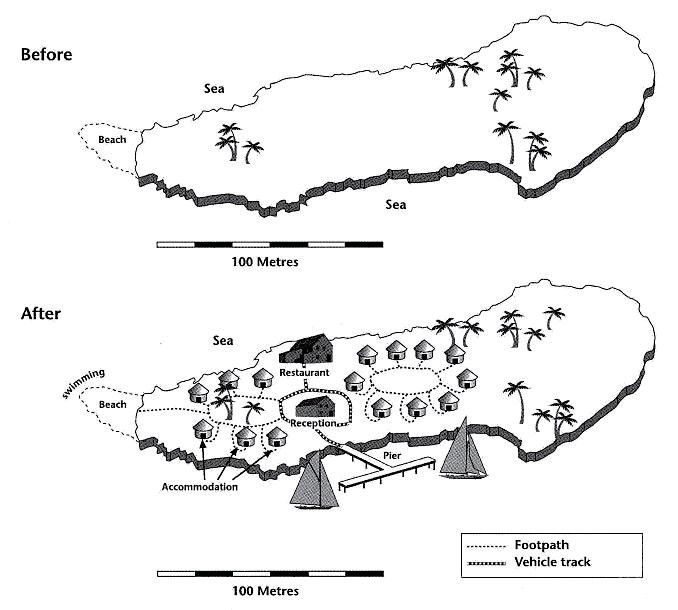
Looking at the maps in more detail, we can see that small huts have been built to accommodate visitors to the island. The other physical structures that have been added are a reception building, in the middle of the island, and a restaurant to the north of the reception. Before these developments, the island was completely bare apart from a few trees.
As well as the buildings mentioned above, the new facilities on the island include a pier, where boats can dock. There is also a short road linking the pier with the reception and restaurant, and footpaths connect the huts. Finally, there is a designated swimming area for tourists off a beach on the western tip of the island.
Xem thêm: Tải sách Essential Grammar In Use
6.6. Bài mẫu miêu tả biểu đồ bằng tiếng Anh 6
The map shows the growth of a village called Chorleywood between 1868 and 1994.
It is clear that the village grew as the transport infrastructure was improved. Four periods of development are shown on the map, and each of the populated areas is near to the main roads, the railway or the motorway.
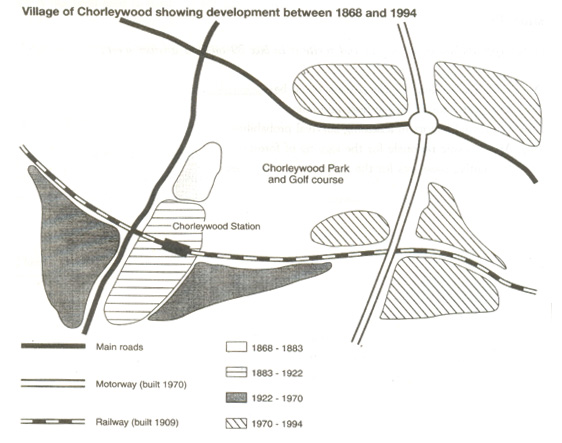
From 1868 to 1883, Chorleywood covered a small area next to one of the main roads. Chorleywood Park and Golf Course is now located next to this original village area. The village grew along the main road to the south between 1883 and 1922, and in 1909 a railway line was built crossing this area from west to east. Chorleywood station is in this part of the village.
The expansion of Chorleywood continued to the east and west alongside the railway line until 1970. At that time, a motorway was built to the east of the village, and from 1970 to 1994, further development of the village took place around motorway intersections with the railway and one of the main roads.
6.7. Bài mẫu miêu tả biểu đồ bằng tiếng Anh 7
The graph compares the GDP per capita, cost of a Toyota Camry, and approximate length of time it takes for 1 citizen to purchase that mode of transport in eight Asian countries.
Despite having the second-lowest average yearly income, it costs more to buy this car in Vietnam than in all but one other Asian nation. It also takes significantly longer for a standard person to buy an automobile in Vietnam than in any other state in Asia. On the other end of the scale, Singaporeans have to pay nearly three times more for their cars than the Vietnamese and it takes them the least amount of time to afford a motor vehicle.
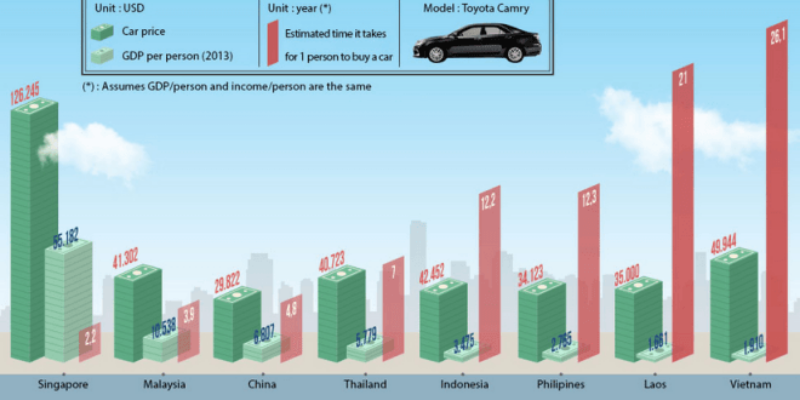
It costs $49,944 to buy a Toyota Camry in Vietnam, but this dwarfs the average yearly income per person at just $1,910. It would therefore take a normal man or woman 26.1 years to save up for that particular car.
This is in contrast to Singapore where it costs $126,245 for that model of the motorcar, however, the average salary is much greater at $55,182. This means that it generally takes just over 2 years for a typical individual from Singapore to acquire this vehicle.
6.8. Bài mẫu miêu tả biểu đồ bằng tiếng Anh 8
The chart gives information about UK immigration, emigration and net migration between 1999 and 2008. Both immigration and emigration rates rose over the period shown, but the figures for immigration were significantly higher. Net migration peaked in 2004 and 2007.
In 1999, over 450,000 people came to live in the UK, while the number of people who emigrated stood at just under 300,000. The figure for net migration was around 160,000, and it remained at a similar level until 2003.
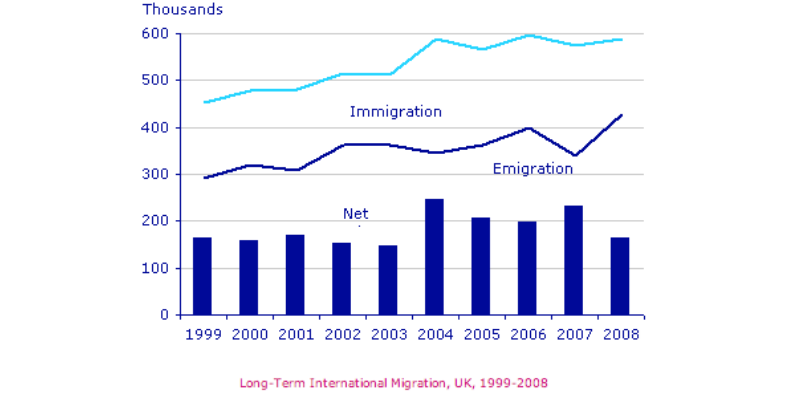
From 1999 to 2004, the immigration rate rose by nearly 150,000 people, but there was a much smaller rise in emigration. Net migration peaked at almost 250,000 people in 2004.
After 2004, the rate of immigration remained high, but the number of people emigrating fluctuated. Emigration fell suddenly in 2007, before peaking at about 420,000 people in 2008. As a result, the net migration figure rose to around 240,000 in 2007, but fell back to around 160,000 in 2008.
6.9. Bài mẫu miêu tả biểu đồ bằng tiếng Anh 9
The pie charts compare the amount of electricity produced using five different sources of fuel in two countries over two separate years.
Total electricity production increased dramatically from 1980 to 2000 in both Australia and France. While the totals for both countries were similar, there were big differences in the fuel sources used.
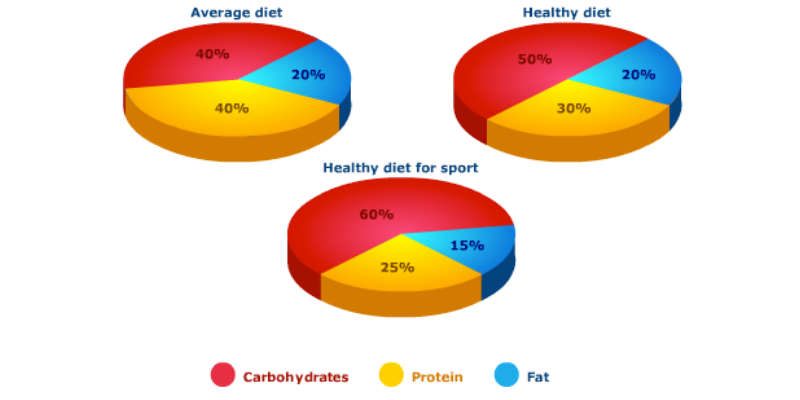
Coal was used to produce 50 of the total 100 units of electricity in Australia in 1980, rising to 130 out of 170 units in 2000. By contrast, nuclear power became the most important fuel source in France in 2000, producing almost 75% of the country’s electricity.
Australia depended on hydro power for just under 25% of its electricity in both years, but the amount of electricity produced using this type of power fell from 5 to only 2 units in France. Oil, on the other hand, remained a relatively important fuel source in France, but its use declined in Australia. Both countries relied on natural gas for electricity production significantly more in 1980 than in 2000.
6.10. Bài mẫu miêu tả biểu đồ bằng tiếng Anh 10
The diagram below shows the water cycle, which is the continuous movement of water on, above and below the surface of the Earth.
The picture illustrates the way in which water passes from ocean to air to land during the natural process known as the water cycle. Three main stages are shown on the diagram. Ocean water evaporates, falls as rain, and eventually runs back into the oceans again.
Beginning at the evaporation stage, we can see that 80% of water vapour in the air comes from the oceans. Heat from the sun causes water to evaporate, and water vapour condenses to form clouds. At the second stage, labelled ‘precipitation’ on the diagram, water falls as rain or snow.
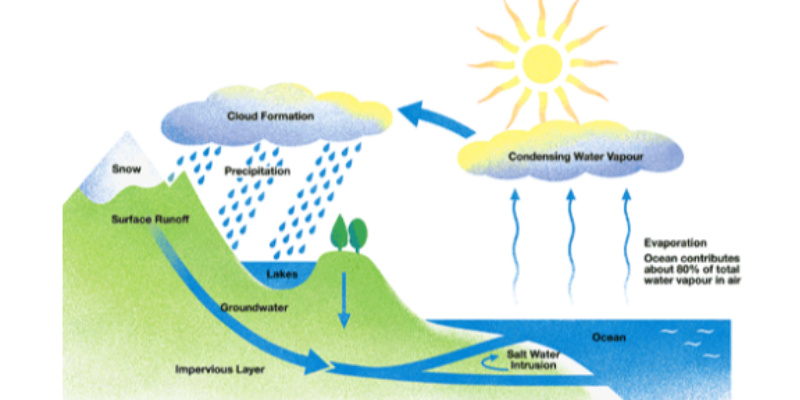
At the third stage in the cycle, rainwater may take various paths. Some of it may fall into lakes or return to the oceans via ‘surface runoff’. Otherwise, rainwater may filter through the ground, reaching the impervious layer of the earth. Salt water intrusion is shown to take place just before groundwater passes into the oceans to complete the cycle.
Trên đây là những chia sẻ và một số bài mẫu về chủ đề miêu tả biểu đồ bằng tiếng Anh trong bài thi Writing IELTS. Hãy áp dụng để bài viết của mình hay hơn, sinh động và lập luận chặt chẽ hơn các bạn nhé! Ieltscaptoc.com.vn chúc bạn thi tốt, đạt được số điểm mình mong muốn.

