Dạng bài bảng biểu – table là 1 dạng khó trong khi thi IELTS writing task 1, nhiều bạn sẽ bị mất rất nhiều thời gian cho task này dẫn đến không còn đủ thời gian task 2 vì thường dạng này chứa nhiều số liệu, thông tin làm nhiều người không biết bắt đầu từ đâu. Biết được điều đó, ieltscaptoc.com.vn sẽ chia sẻ cho bạn cách viết writing task 1 table hay nhất giúp bạn tránh lan man khi làm bài, hãy tham khảo ngay nhé
Nội dung chính
1. Tìm hiểu về IELTS Writing task 1 dạng Table
Biều đồ bảng biểu, table là 1 bảng hay nhiều bảng biển diễn số liệu, có nhiều cột và nhiều hàng trong 1 bảng. Những số liệu này nhằm so sánh giữa các đối tượng với nhau.
Ví dụ: Bảng biểu dưới đây chứa rất nhiều số liệu
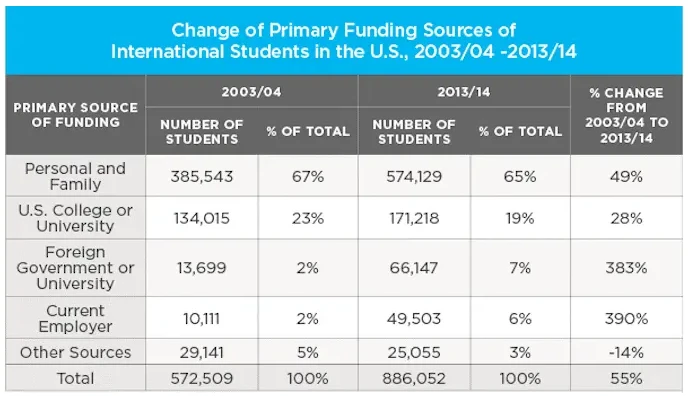
Table chart còn được gọi là “version 2” của Bar chart: Vì trong 2 dạng biểu đồ này đều thể hiện sự so sánh thông tin dữ liệu với nhau, giống nhau về cấu trúc so sánh và cách biểu diễn số liệu.
2. Phân loại IELTS Writing task 1 dạng Table
Bảng không thay đổi theo thời gian và bài có bảng thay đổi theo thời gian
2.1. Biểu đồ có mốc thời gian cố định – Không có sự thay đổi về thời gian
Ở dạng này, chúng ta không thể chỉ ra xu hướng của các số liệu vì các số liệu này không thay đổi theo thời gian mà hoàn toàn là số liệu tĩnh. Thay vào đó, bạn cần so sánh các số liệu bằng cách lựa chọn những đặc điểm chính của nó và mô tả.
Đặc điểm chính của dạng biểu đồ này thường là điểm cao nhất và thấp nhất của đối tượng so sánh.
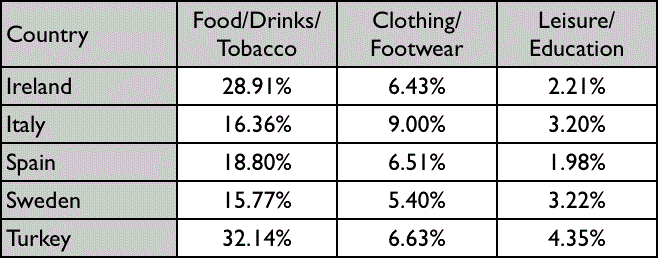
Trong bảng này, có 3 tiêu chí được dùng để so sánh giữa 5 nước với nhau và trong cùng 1 thời điểm cụ thể, vậy nên đây là dạng Table không có thời gian
2.2. Biểu đồ 2 bảng – Có sự thay đổi thời gian
Với dạng có yếu tố thời gian, bản chất của dạng này sẽ giống như biểu đồ line chart, tức là các bạn sẽ sử dụng các từ vựng chỉ sự tăng trưởng như increase, decrease… như trong line chart
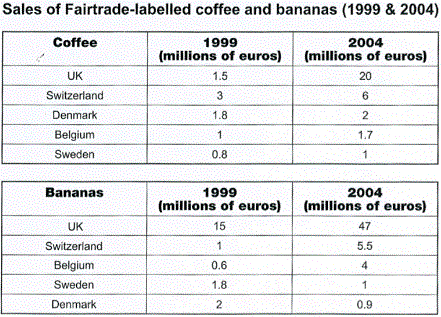
2 bảng về 2 đối tượng khác nhau là coffee và bananas. Ở mỗi bảng của 1 đối tượng, số liệu của mỗi nước có sự thay đổi giữa 2 năm 1999 so với 2004
3. Cấu trúc IELTS Writing Task 1 – Dạng Table
3.1. Introduction
Ở phần mở bài, việc giới thiệu lại đây là dạng graph/ diagram gì là rất quan trọng (dù đã biết là dạng table). Ngoài ra, bạn cần giới thiệu table được cho là nghiên cứu, thống kê về vấn đề gì bằng cách paraphrase lại đề bài.
Ví dụ:
The table below gives information about the values of exports of kiwi fruit (NZ$) from New Zealand to five countriesbetween 2010 and 2012.
| Give information | -> show |
| The values of exports of kiwi fruit | -> earnings from Kiwi exportation |
| five countries | -> five different nations |
| (NZ$) | -> units are measured in NZ$ |
| between 2010 and 2012 | -> in three consecutive years 2010, 2011 and 2012 |
The given table showsearnings from Kiwi exportation from New Zealand to five different nations. Units are measured in NZ$, and the data were collected in three consecutive years 2010, 2011 and 2012.
Các từ có thể thay thế được cho “show”:
- Describe
- Detail
- Demonstrate
- Introduce
- Give information
- Compare the information about
3.2. Overview
Overview có thể hiểu là phần tóm tắt bao quát các đặc điểm nổi trội nhất của table. Vì vậy ở phần này, bạn không nên nêu quá chi tiết (nêu số liệu) để tránh sang phần thân bài không còn thông tin để nêu. Tuy nhiên, nếu phần overall quá chung chung, không nêu đủ những phần nổi bật ở table thì cũng không đạt yêu cầu.
Vì vậy, để có thể nêu rõ và đầy đủ các đặc trưng đó, bạn nên:
Nhìn theo chiều dọc và chiều ngang của table để nhận ra các đặc trung khác nhau theo từng kiểu phân loại khác nhau (Có sự tương đồng, giống nhau nào giữa các số liệu ở cùng hàng hay cùng cột không? Có sự khác biệt, tương phản nào giữa các số liệu ở cùng hàng hay cùng cột không?) Chú ý những số liệu cao nhất và thấp nhất, chú ý những số liệu ít có sự thay đổi (nếu có năm)
Ví dụ:
- Nhìn vào cột thứ nhất Food/ Drinks/ Tobacco, ta sẽ chú ý tới các số 32.14% (cao nhất), 15.77% (thấp nhất)
- Nhìn vào cột thứ nhất Food/ Drinks/ Tobacco, ta sẽ chú ý tới các số 32.14% (cao nhất), 15.77% (thấp nhất)
- Nhìn vào cột thứ nhất Food/ Drinks/ Tobacco, ta sẽ chú ý tới các số 32.14% (cao nhất), 15.77% (thấp nhất)
Xem thêm: Bài tập mệnh đề quan hệ cơ bản đến nâng cao có đáp án
3.3. Body
Dạng table được phân thành 2 loại, có xu hướng thay đổi theo thời gian và không thay đổi theo thời gian
Thay đổi theo thời gian
Ở dạng này, từng item trong bảng sẽ thay đổi theo thời gian. Vì vậy, ngôn ngữ thể hiện xu hướng (tăng, giảm, không thay đổi,…) nên được sử dụng kèm với ngôn ngữ so sánh (comparison: cao hơn, thấp hơn, cao nhất, thấp hơn, đứng thứ 2,3,…).
Không thay đổi theo thời gian
Vì dạng này không có xu hướng thay đổi theo thời gian, nên sẽ có ít thông tin được báo cáo hơn (chỉ sử dụng ngôn ngữ so sánh).
Lưu ý
- Không liệt kê số liệu mà phải phân tích, tổng hợp để tìm ra mối quan hệ giữa các số liệu với nhau.
- Phân tích đúng và đầy đủ số liệu (thời gian, địa điểm, chiếm bao nhiêu, ai/cái gì…)
Ngôn ngữ so sánh
- The highest/ lowest = least…,followed by [số liệu cao thứ 2] and [số liệu cao thứ 3] , at [data]
- The second highest/lowest
- While/ whereas/Although A is…, B is much higher/lower
- A similar pattern between A and B
- There is a similarity between A and B
- …, which is the same as…
Ngôn ngữ thể hiện xu hướng tăng giảm
- Increase/ grow/ go up: tăng
- Decrease/ drop/ decline /go down: giảm
- Reach its top/peak: chạm đỉnh/ điểm cao nhất
- Reach its bottom: chạm điểm thấp nhất
- A dip/ plummet/ plunge (n): sự giảm mạnh
- Rocket/ soar (v): tăng mạnh
- Upward/downward trend : xu hướng tăng/giảm
- Ups and downs / fluctuation (n): biến động
- Steady/ gradual/ consistent/ constant (a): chầm chậm/ đều đặn
- Significant / remarkable/ noticeable (a): mạnh, đáng kể
- Sudden (a): đột ngột
4. Các bước viết IELTS writing task 1 – dạng table
Để viết một bài bảng số liệu – Table cũng sẽ cần 3 bước, đó là: Phân tích – Viết – Hiệu đính.
Trong bài viết 3 bước cực nhanh để viết IELTS Writing Task 1, đã có hướng dẫn rất chi tiết làm thế nào để thực hiện 3 bước này. Nếu chưa nắm chắc, bạn phải đọc ngay để bắt đầu chuyển sang các phần tiếp theo nhé.
4.1. Phân tích bảng biểu – table thế nào cho đúng?
Chỉ cần nhìn qua 2 ví dụ trên là bạn có thể thấy là mỗi bảng có tới hàng chục số liệu, để mà mô tả hết về chúng trong 20 phút có vẻ là nhiệm vụ bất khả thi nhỉ.
Bạn cần phải phân tích rất kỹ table để tìm ra dữ liệu để viết, chúng ta không thể ôm trọn số liệu trong bảng được. Cần phải có yếu tố chọn lọc để tìm ra các đặc điểm chính trong bảng. Để tìm được dữ liệu chính, quan trọng, đặc biệt nhất, bạn cần phải biết phương pháp.
Đó là, chia để trị. Nói đơn giản là thay vì quan sát toàn bộ bảng, chúng ta chỉ đánh giá và quan sát các cột và hàng trước đã. Dữ liệu lúc này đã xuất hiện 2 nhóm thông tin là theo hàng (row) và theo cột (column).
Khi tiến hành phân tích, bạn cũng chú ý tới các đặc điểm chính
- Dữ liệu có giá trị cao nhất
- Dữ liệu có giá trị thấp nhất
- Dữ liệu cao hay thấp thứ 2 (nhưng phải gần với 2 con số ở trên)
- Có sự tương đồng, giống nhau nào giữa các số liệu ở cùng hàng hay cùng cột không.
- Có sự khác biệt, tương phản nào giữa các số liệu ở cùng hàng hay cùng cột không.
Một mẹo ở đây là bạn nên phân tích theo cột trước khi phân tích theo hàng
- Ví dụ, nhìn vào cột thứ nhất Food/Drinks/Tobacco, ta sẽ chú ý tới các số 32.14% (cao nhất), 15.77% (thấp nhất)
- Ở cột thứ hai, Clothing/Footwear, ta sẽ thấy con số 9.00% và 5.40% là đặc biệt vì cao và thấp nhất.
- Ở cột thứ ba, Leisure/Education, ta chú ý tới 4.35% và 1.98%
- Phân tích theo hàng, chúng ta sẽ thấy là các thông tin ở cột 1 lớn nhất, rồi tới cột 2, rồi cột 3 ở mỗi hàng.
- Đưa con số vào với tên của đối tượng thì ta thấy là Turkey có vẻ có các con số cao nhất rồi nhỉ.
- Còn Ireland là không có thông tin nào đặc biệt được nêu ra cả, thế thì biết lấy số nào. Lúc này các bạn nhớ ở trên mình gợi ý là dùng cả con số cao thứ 2 không? Nhưng nó phải gần với số cao nhất. Thế thì mình sẽ lấy 28.91% nhé.
4.2. Chuẩn bị về mặt từ vựng & cấu trúc ngữ pháp hữu ích
Mô tả xu hướng
| Cấu trúc: There + be + adj + noun + in + noun phrase |
Adjectives: gradual, moderate, modest, sharp, dramatic, slight, steep, steady, significant, considerable, rapid
Nouns: variation, decline, decrease, drip drop, fall peak, fluctuation, growth, increaserise, slump
| Cấu trúc: Noun phrase + verb + adverb |
Verbs: rise, jump, grow, climb, increase, rocket, fall, drop, decline, decrease, go down, plummet, plunge
Adverbs: gradually, moderately, modestly, sharply, dramatically, slightly, steeply, steadily, significantly, considerably, rapidly, slowly
Mô tả sự so sánh
| Cấu trúc: More/few/less + noun + than |
Example: Overall, more people preferred public transport than taxis.
| Cấu trúc: of one syllable -er + than |
Example: A higher number of people preferred public transport than taxis.
| Cấu trúc: More/less + adj. of more than one syllable + than |
Example: Taxis were more popular than public transport.
| Cấu trúc: of one syllable -est. |
Example: The highest % of commuters preferred taxis.
| Cấu trúc: The most/least + adj. of more than one syllable |
Example: The least popular mode of transport was buses.
5. Bài mẫu IELTS Writing task 1 dạng Table
5.1. IELTS Writing task 1 dạng Table – Sample 1
Đề bài
The table below gives information on consumer spending on different items in five different countries in 2002. Summarise the information by selecting and reporting the main features and make comparison where relevant.

Bài mẫu tham khảo
The table compares the percentages of money spent on three different categories by consumers in five nations in 2002.
It is clear that Turkish people were the largest spenders on food/drinks/tobacco and leisure/education while the highest expenditure on clothing/footwear was recorded in Italy. Overall, food/drinks/tobacco always had the highest spending among those three categories.
Well under a third of spending on food/drinks/tobacco was from people in Turkey, followed by nearly 29% in Ireland. Similarly, the percentage of money paid for leisure/education was also highest in this nation, at 4.35% while most money allocated for clothing/footwear was by Italians, with 9%.
In contrast, the lowest expenditure on food/drinks/tobacco belonged to Sweden, accounting for just under 16%, and Swedish people also expended the least money on clothing/footwear, with 5.4%. By comparison, only under 2% of the money was used for leisure/education by Spanish consumers, which is also the smallest figure on the chart.
5.2. IELTS Writing task 1 dạng Table – Sample 2
Đề bài
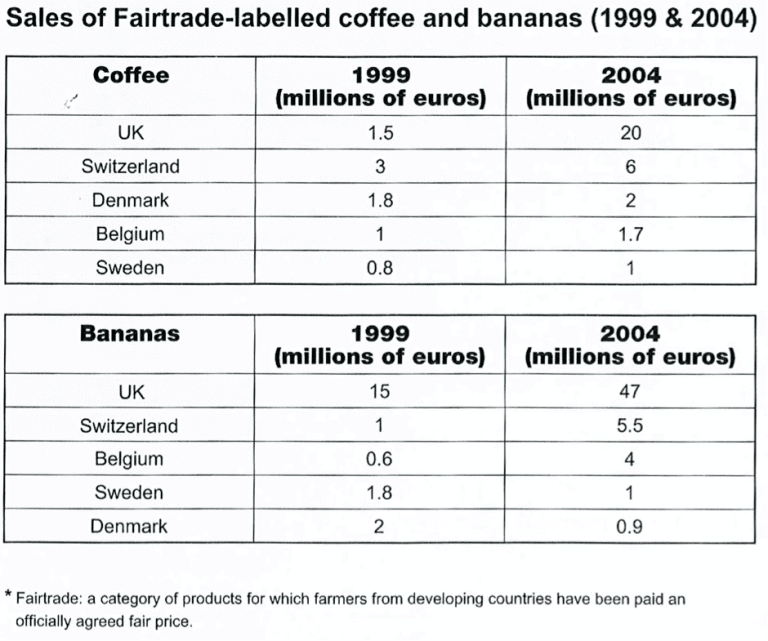
The tables below give information about sales of Fairtrade-labelled coffee and bananas in 1999 and 2004 in five European countries. Summarise the information by selecting and reporting the main features, and make comparisons where relevant.
Bài mẫu tham khảo
The tables compare the amounts of money gained from selling coffee and bananas in two years, 1999 and 2004 in five countries in Europe.
Overall, sales of those goods mostly increased between two years, except for the figures for bananas in Sweden and Denmark. The UK earned more money from both coffee and bananas than any other countries in 2004.
Looking at coffee’s turnover, Switzerland earned 3 million euros from selling this commodity in 1999, followed by around 1.5 and 1.8 million euros in the UK and Denmark respectively. The lowest figure was recorded in Sweden at that time, with 0.8 million euros. After five years, the UK became the biggest earner from purchasing coffee, with its figure reaching 20 million euros. The other data climbed by about 0.2 to 3 million euros only.
Regarding bananas’ sales, the UK always ranked top, recording 15 million euros in 1999 which rose threefold after five years. Switzerland and Belgium also experienced a growth in its sales, to 5.5 and 4 respectively, but the opposite was true for Sweden and Denmark whose figures decreased by about 1 million euro over the period.
5.3. IELTS Writing task 1 dạng Table – Sample 3
Đề bài
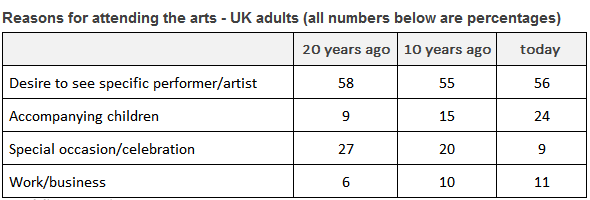
The table below shows the results of a 20-year study into why adults in the UK attend arts events. Summarise the information by selecting and reporting the main features, and make comparisons where relevant.
Bài mẫu tham khảo
The table illustrates four reasons why adults in the UK have attended arts events over the past twenty years. The major reason over the whole twenty-year period was a desire to see a specific performer or artist; while the least important reason was attending arts events for work-related reasons.
The percentage of people who attended events out of a desire to see a particular performer has remained relatively stable throughout the twenty-year period; varying from 58% twenty years ago to 56% today.
On the other hand, the percentage of people accompanying children has shown a significant increase, from 9% 20 years ago to just under a quarter today. As far as those who attended arts events because of special occasions or celebrations are concerned, the percentage fell slightly from 27% 20 years ago to 20% a decade ago, dropping dramatically to 9% today.
There has been a slight increase in the percentage of people attending arts events for work or business, from 6% 20 years ago to just over 10% today.
Overall, there has been a rise in people attending events in order to accompany children and for work-related reasons, while fewer people choose to attend an arts event as a form of celebration.
5.4. IELTS Writing task 1 dạng Table – Sample 4
Đề bài
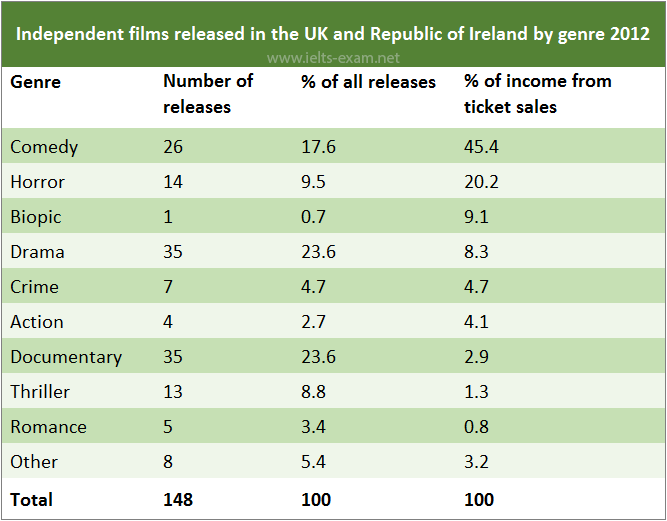
The table below gives information about UK independent films. Summarise the information by selecting and reporting the main features, and make comparisons where relevant.
Bài mẫu tham khảo
The table provides information about different types of independent films released in the UK and the Republic of Ireland in 2012. It indicates how many films of different genres were made and also shows what proportion of total ticket sales was made by each kind of film.
The table makes it very clear that there is no correlation between the number of films made in any category and the proportion of ticket sales earned by that sort of film. For example, the largest numbers of films were made in the Drama and Documentary categories – 35 of each of these were released. However, they earned only 8.3 and 2.9 percent of total ticket sales respectively.
Comedy films were the most financially successful: 26 films, out of a total of 148, earned 45.4 percent of all the income from ticket sales. Another very successful type of film in 2012 was the biopic. Although only one of these was released, it accounted for 9.1 percent of ticket sales.
5.5. IELTS Writing task 1 dạng Table – Sample 5
Đề bài
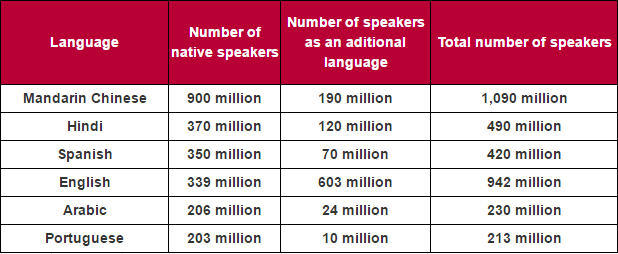
The table below gives information about languages with the most native speakers. Summarise the information by selecting and reporting the main features, and make comparisons where relevant.
Bài mẫu tham khảo
The table illustrates the number of native speakers of six languages as well as the number of speakers of these languages as an additional language. It is noticeable that the number of speakers of Mandarin Chinese is strikingly higher than the other languages with over one billion speakers.
People who speak Mandarin largely speak it as a first language (900 million). In comparison to this only 190 million people speak Mandarin Chinese as an additional language. What is remarkable about English speakers is that the number of speakers of English as an additional language is higher than that of native speakers of English (603 and 339 million respectively).
While the total number of Hindi speakers (490 million) is roughly equal to that of Spanish speakers (420 million); when it comes to speaking these languages as an additional language the number for Hindi is much higher (120 million) than that for Spanish (70 million).
Native speakers of Arabic and Portuguese are similar in number with 206 million and 203 million respectively. However, the number of Arabic speakers as an additional language (24 million) is almost 2.5 times higher than speakers of Portuguese as an additional language.
Xem thêm: Bài tập Phrasal Verb đầy đủ nhất
5.6. IELTS Writing task 1 dạng Table – Sample 6
Đề bài
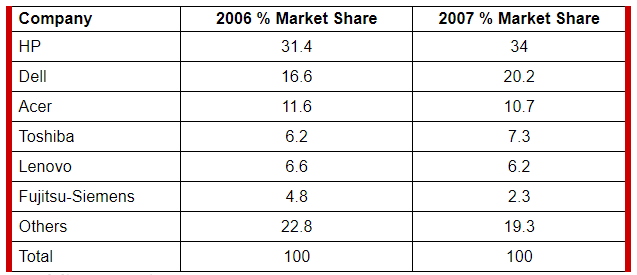
The table below shows the worldwide market share of the notebook computer market for manufacturers in the years 2006 and 2007. Summarise the information by selecting and reporting the main features, and make comparisons where relevant.
Bài mẫu tham khảo
The table gives information on the market share of notebook computer manufacturers for two consecutive years, 2006 and 2007.
In both years, HP was clearly the market leader, selling 31.4% of all notebook computers in 2006, and slightly more (34%) in 2007. This is a greater market share than its two closest competitors, Dell and Acer, added together.
Dell increased its market share from 16.6% in 2006 to 20.2% in 2007. In contrast, Acer saw its share of the market decline slightly from 11.6% to 10.7%.
The other companies listed each had a much smaller share of the market. Toshiba’s share increased from 6.2% in 2006 to 7.3% in 2007, whereas Lenovo’s decreased slightly from 6.6% to 6.2%. Fujitsu-Siemens’ share more than halved from 2006 to 2007: from 4.8% of the market to only 2.3%.
Other notebook computer manufacturers accounted for 22.8% of the market in 2006 – more than all the companies mentioned except HP. However, in 2007 the other companies only made 19.3% of notebook computer sales – less than both HP and Dell.
5.7. IELTS Writing task 1 dạng Table – Sample 7
Đề bài
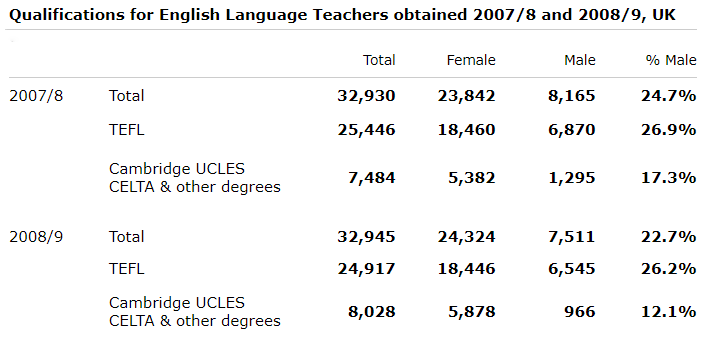
The table below shows the number of students living in the UK gaining English language teacher training qualifications in 2007/8 and 2008/9, and the proportion of male qualifiers.
Summarise the information by selecting and reporting the main features, and make comparisons where relevant.
Bài mẫu tham khảo
This report summarises information on the total number of students in the United Kingdom who gained qualifications for English Language Teachers in two academic years, 2007/8 and 2008/9, with specific focus on the number of male qualifiers.
In both years, the total numbers of students remained the same, but there was a great difference between the numbers of male and female students who qualified. In 2007/8, out of a total of 32,930 students, only 24.7% were male. The percentage of males who qualified in 2008/9 was even lower. Out of a total of 32,945 students, only 22.7% of them were male. This is a drop of 2%.
There was also a large difference in the qualifications that students studied for. Most students qualified with a TEFL certificate; this was true for male students. The number of students who qualified with the TEFL was roughly three times the number who qualified with a Cambridge UCLES CELTA or other degrees, although the total number of students qualifying with the TEFL dropped slightly, from 25,446 in 2007/8 to 24,917 a year later. There was a drop of 0.7% in the number of male students who gained this qualification.
In general it can be seen that the number of males qualifying as English language teachers is vastly outnumbered by females and that the proportion of male qualifiers is gradually dropping.
5.8. IELTS Writing task 1 dạng Table – Sample 8
Đề bài
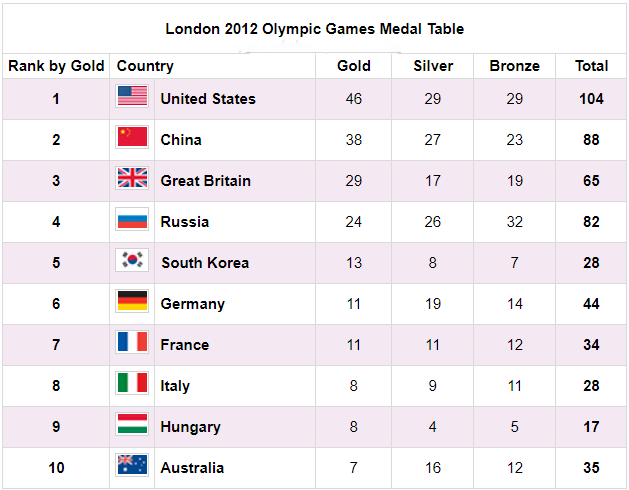
The table below shows the number of medals won by the top ten countries in the London 2012 Olympic Games. Summarise the information by selecting and reporting the main features, and make comparisons where relevant.
Source: http://www.london2012.com/medals/medal-count/
Bài mẫu tham khảo
The table shows the number of medals won by the top ten countries in the London 2012 Olympic Games. The USA won greatest number of medals overall with the total of 104.
They won more gold medals than silver and more medals than any other country in both categories. China had the second number of medals at 88, and like the USA, China won fewer silver medals than gold medals.
While Russia’s silver medal total was better than Great Britain’s, they did not do as well as Great Britain in the gold medals, winning just 24. In fact Great Britain had a lower overall medal total than Russia but, as the table is based on the number of gold medals won, they were placed third.
Similarly, Germany was significantly more successful at winning medals than South Korea, with a total of 44 compared to South Korea’s 28, but because South Korea won two more gold medals than Germany they were ranked higher. Australia gave the worst performance in this group, winning only seven gold and sixteen silver medals.
Xem thêm: Bài tập động từ nguyên mẫu, V-ing đầy đủ nhất có đáp án
5.9. IELTS Writing task 1 dạng Table – Sample 9
Đề bài
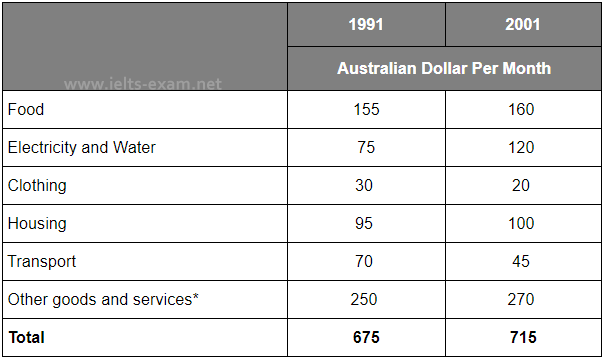
The table below shows the monthly expenditure of an average Australian family in 1991 and 2001. Summarise the information by selecting and reporting the main features, and make comparisons where relevant.
*Other goods and services: non-essential goods and services
Bài mẫu tham khảo
The table shows changes in the spending patterns of an average Australian household between 1991 and 2001. In general, Australian household spending was high in 2001 than in 1991 but the difference was not significant (AUD $715 per month and AUD $675 per month respectively).
The amount of monthly spending on electricity and water saw a dramatic increase over the 10-year period from $75 to $120. Yet in terms of the expenditure on non-essential goods and services, the rising trend was less obvious with a minor increase of $20. At the same time, the amount of money spent on food and housing rose only slightly from $155 to $160 and $95 to $100 respectively.
However, there was a decrease in expenditure on the other two items. Australians spent one third less on clothing, which fell from $30 to $20. Similarly, expenditure on transport dropped from $70 in 1991 to $45 in 2001.
It seems that food and “other goods and services” were the two biggest items of expenditure. Altogether, they accounted for more than half of the total household spending. By comparison, Australians spent little on
Với tần suất xuất hiện ngày càng nhiều, việc nắm vững các bước trong cách viết writing task 1 table sẽ giúp bạn dễ dàng và nhanh chóng hoàn thành phần thi này, hướng đến Target Band 7.0+ cho cả phần thi Writing. Ieltscaptoc.com.vn chúc các bạn học tập và ôn luyện tốt cho bài thi IELTS!

